Obesity is a major issue in the US and in recent years the rates of obesity have been increasing.
Being overweight itself is not a morally bad thing, here at StatsExamples we don't believe in fat-shaming, what is considered attractive or beautiful is a purely societal issue. Nevertheless, the fact is that being heavier can lead to serious health problems and expensive medical problems.
Health problems associated with obesity reduce lifespan and can lower quality of life. Being obese increases the risk of developing serious medical conditions like cancer, diabetes, and metabolic syndrome.
For these and other reasons, people often seek to lose weight and the most common suggestions are better diet and exercise.
But what kinds of exercise or diet work?
The suggestions to get exercise are often along the lines of "30 minutes per day", but fitting that into your day can be a challenge. Finding that time is hard for people with long commutes, unpredictable schedules, childcare issues, or the elderly. To be able to do this you probably have to belong to a gym (which costs money) or live in a a neighborhood where you can go running (which eliminates many urban areas and much of the country in the winter). But maybe that 30 minute recommendation is too ambitious, perhaps just getting out and doing something once in a while on the weekends is enough.
As for diet, everyone has heard the advice to eat more fresh fruit and vegetables, but is one of these more important that the other? Fruit is obviously full of nutrients, but fruit also has sugar which can contribute to weight gain. Vegetables are good too, but it can be hard for many people to get motivated to eat vegetables without some extra-calorie help (e.g., salad dressing) to make them a tasty part of a satisfying meal. A lot of advice in the media comes from people who have spacious nice kitchens and lots of free time to prepare interesting meals (and sell books) so their advice can seem unrealistic or suspect (e.g., "buy my book").
What about everyday people with budgets and busy schedules? What actually works?
Luckily the CDC (Centers for Disease Control and Prevention) has collected data that can shed light on these questions. We here at StatsExamples took a look at some of this data and decided to share what we learned.
All of the data we discuss below comes from an online resource called the "National Center for Chronic Disease Prevention and Health Promotion, Division of Nutrition, Physical Activity, and Obesity. Data, Trend and Maps [online]" available at: www.cdc.gov. This data is based on a series of surveys of thousands of people from each of the 50 states (and DC) and average values were calculated for each state.
In all the figures below the Y-axis (the dependent or response variable) shows the percentage of people in the state who were obese (defined as having a BMI > 30, see footnote 1 below). The X-axis (the independent or predictor variable) will vary depending on factor they looked at. Since these are associations they can be used to identify correlations suggestive of, but not proof of, causality. Since we are looking at factors one-by-one we are also ignoring other factors and interdependence between the factors (e.g., people who eat vegetables may also eat fruit so the patterns aren't really independent). Nevertheless, the R2 values can give us a sense of what the most important factors are likely to be.
Exercise
In the CDC data set they looked at a variety of measurements of exercise, but we'll focus on just two here.
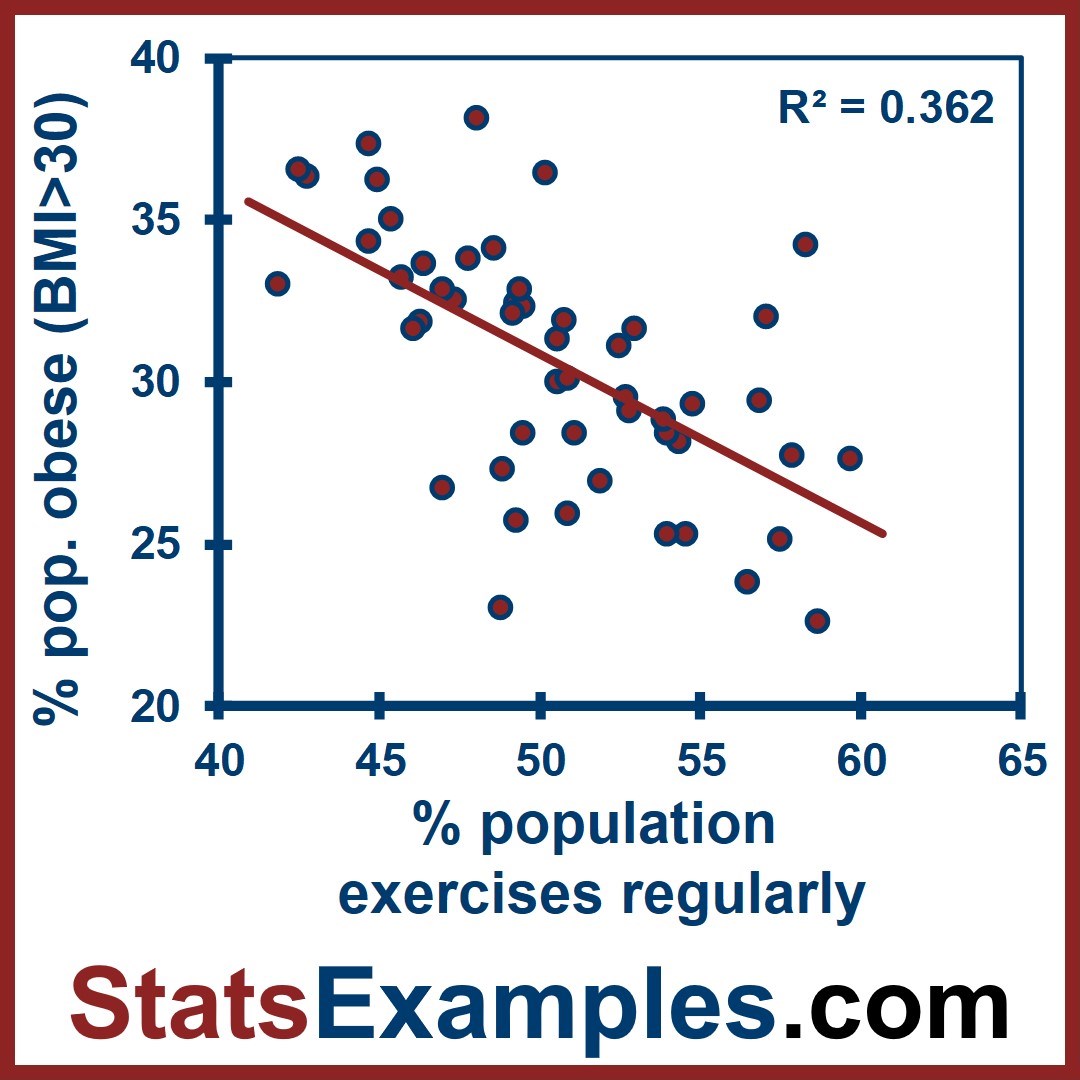
The first set of exercise data is the percentage of people who participated in either 150 minutes per week of moderate intensity exercise or 75 minutes per week of vigorous exercise (footnote 2 gives the exact CDC wording). This is essentially a measure of how many people report that they regularly exercise several times per week. The R2 value for this data is 0.362 which suggests that 36% of the variance in obesity is explained by whether people engage in regular weekly exercise or not. This isn't proof that regular exercise reduces obesity, but is evidence that supports a process in which it does.
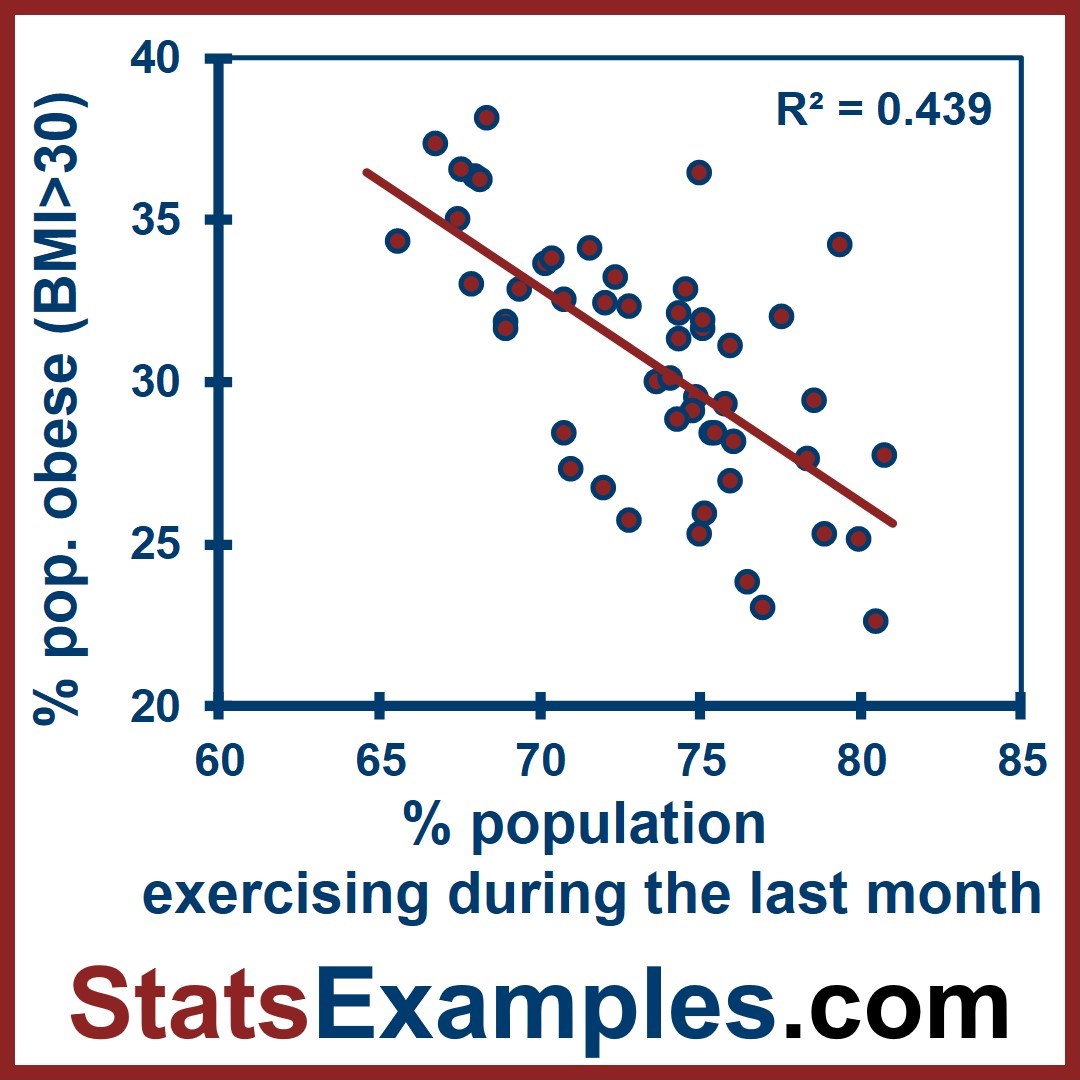
The second set of exercise data is the percentage of people who did at least one form of exercise during the previous month (footnote 3 gives the exact CDC wording). This is a combined measure of how many people regularly exercise along with people who generally don't, but do play golf or hike once in a while; people who exercise for leisure, but not regularly. The R2 value for this data is 0.439 which suggests that 44% of the variance in obesity is explained by whether people engage in occasional to regular exercise or not.
Comparing these R2 values, since the second is larger than the first, it suggests that even occasional exercise can be beneficial. Perhaps hitting the gym 5 days a week isn't needed, just doing something once in a while may help. The data doesn't separate these two types of people however. That being said, the increase of 8% in the R2 attributable to casual infrequent exercise may be as large as eating a diet than includes vegetables (see below).
Diet
In the CDC data set they looked at a variety of measurements of diet, but we'll focus on just two here.
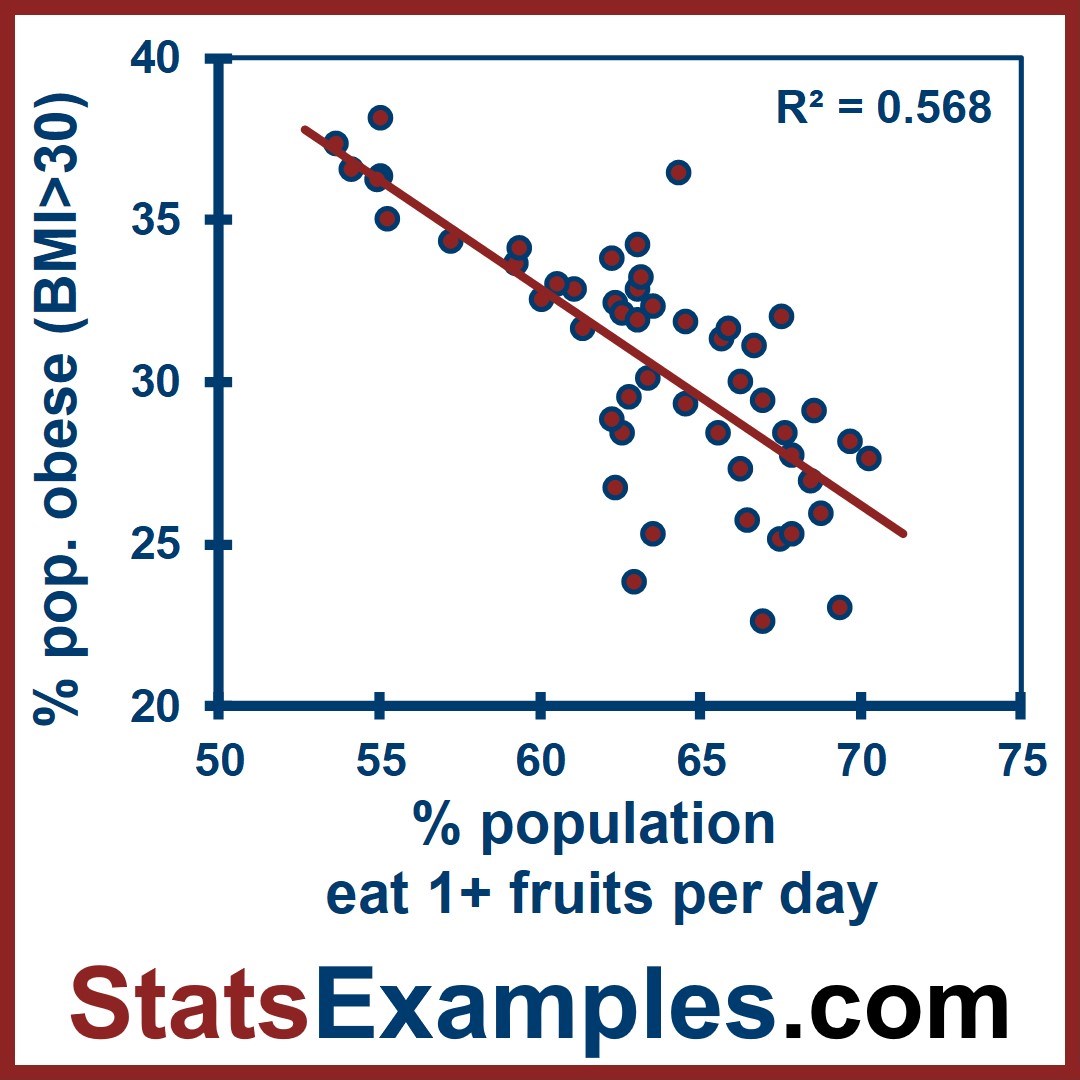
The first set of diet data is the percentage of people who reported eating 1 or more servings of fruit per day (footnote 4 gives the exact CDC wording). This is a measure of how many people report that they regularly eat fruit or drink fruit juice. The R2 value for this data is 0.568 which suggests that 57% of the variance in obesity is explained by whether people eat fruit or not. This isn't proof that eating a diet that includes fruit or drinking fruit juice reduces obesity, but is evidence that supports a process in which it does.
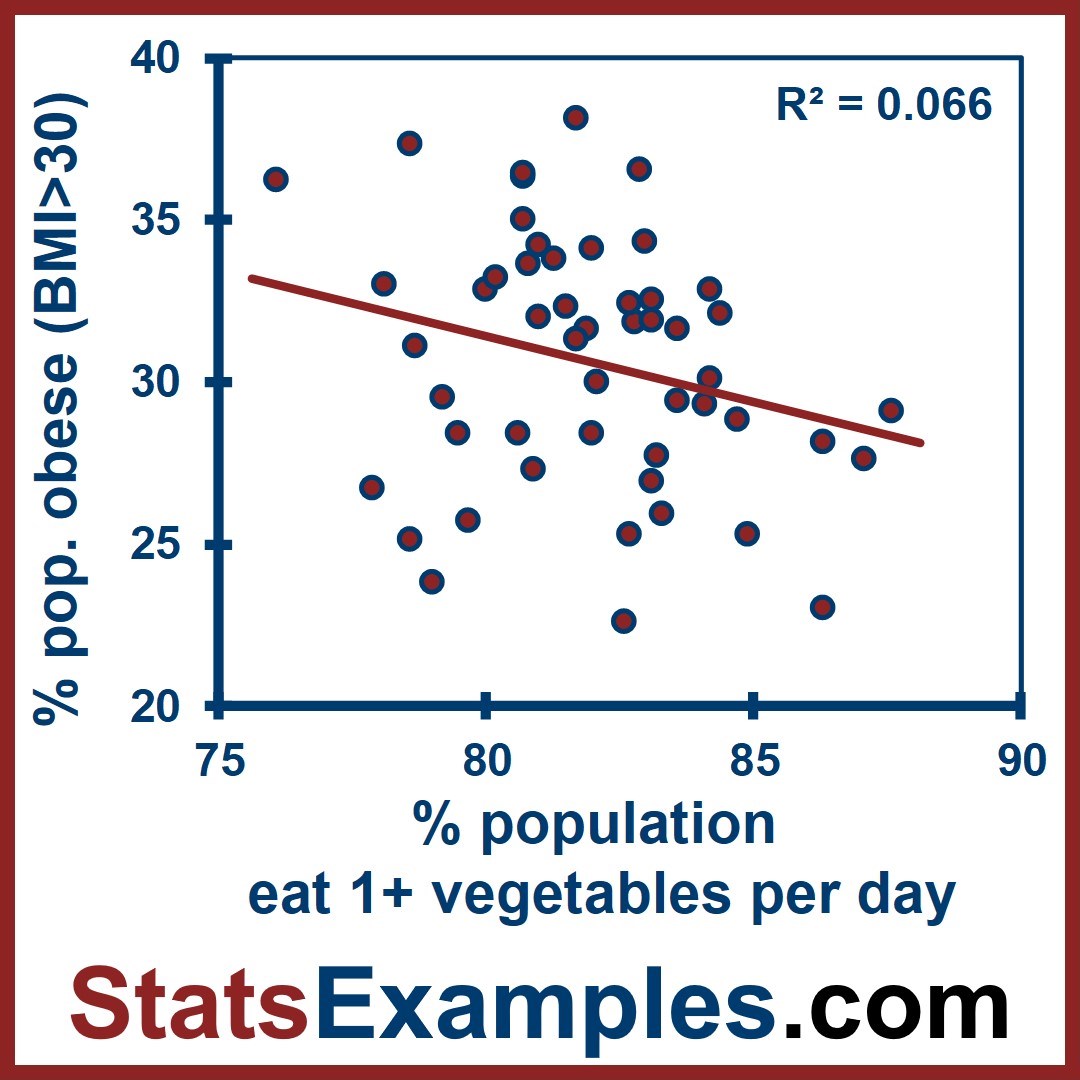
The second set of diet data is the percentage of people who reported eating 1 or more servings of vegetables per day (footnote 3 gives the exact CDC wording). This is a measure of how many people report that they regularly eat salads, potatoes or other vegetables. In contrast to the previous factors which seemed to show a consistent relationship with obesity, the R2 value for this data is 0.066 which suggests that only 7% of the variance in obesity is explained by whether people eat vegetables or not. This is quite weak evidence that eating a diet that includes vegetables reduces obesity, if it even does so at all.
Comparing these R2 values, it seems like fruit consumption is a far better predictor of obesity than vegetable consumption. In fact, the relationship between eating vegetables and reduced risk of obesity is extremely small - less than 20% of what was seen for both measures of exercise or eating fruit. The R2 of 7% for eating vegetables is essentially the same as the increase of 8% in the R2 when comparing the regular exercisers to the occasional ones. This suggests that just a bit of leisure exercise is as effective as eating vegetables in terms of reducing risk of obesity.
Conclusion
The CDC data certainly seems to suggest that exercise and diet are both important to prevent obesity. Not a surprise. In particular, regular moderate or vigorous exercise and eating fruit both seem effective. Doing casual exercise or eating vegetables may help as well, but these appear much less important.
We can see that the exercise and diet factors aren't independent however. Adding the R2 of 44% for regular and casual exercise to the R2 of 57% for eating fruit would result in an R2 of 101% which leaves no room for any other factors at all. This isn't realistic; there are obviously genetic and non-diet environmental factors that are important for some people. The data makes it clear that people who exercise also tend to have diets with more fruit. As with many things in life (and statistics) we can't look at things in isolation and think there is a single easy explanation.
Caveats (i.e., cautions)
The first is a classic, correlation does not imply causation. That doesn't mean that these patterns can just be dismissed, but it does mean that the actual cause may be indirect or due to some third factor. A variety of other factors may create, or partly create, these patterns.
For the exercise factors we can think of several possibilities.
First, people who are not obese are more prone to be active. If a state has a lower rate of obesity due to some other cause, then we would see more people exercising even if the exercise itself didn't cause the reduced obesity.
Second, higher incomes correlate with lower risk of obesity (citation) and people with higher incomes are more likely to be able to afford gym memberships, golf games, and buying nice hiking gear. If wealth itself both reduced obesity risk and increased exercise separately, then we would see a relationship between them even if exercise had nothing to do with obesity directly. Since states vary in their average levels of wealth, this may contribute to the pattern in the data we analyzed.
For the diet factors we can also think of several possibilities.
First, the income factor again. People with higher incomes are more likely to be able to afford fruit which is often a bit more expensive than processed foods. This may also explain why we don't see the pattern for vegetables since they are typically less expensive and affordable for everybody. The kinds of jobs associated with higher incomes may also allow more time for food preparation and use of fruits and vegetables compared to the kind of cooking poorer individuals with irregular hours or long commutes by public transport (which makes daily grocery shopping difficult) can easily do.
Second, diet is also closely connected to culture and if there are cultural differences in the amount of fruits and vegetables consumed, and members within these cultures experience obesity for completely different reasons, this may lead to the pattern seen. For example, US Hispanics tend to have higher rates of obesity than non-Hispanic whites and Asians (citation) yet they also consume more vegetables, but not more fruit (citation). If cultural factors both encourage obesity and the eating of vegetables, then this would obscure an overall relationship between eating more vegetables and lower risk of obesity, especially in data like that we examined above which does not consider such groups separately.
Another potentially confounding factor is more mathematical. One aspect of our data that we should consider is that the vegetable data set is a bit different from the other data sets. If you look at the plots above you can see that while the Y-axis values are all the same and equally variable across the data sets, the vegetable diet data has a much narrower X-axis range. For the vegetable diet question, most data values are within a 5% range and almost all the data is within 10%, versus the other factors which have ranges of 15% or more. Although the study did survey thousands of individuals in each state, there is still measurement error and the magnitude of that measurement error (i.e., noise to signal ratio) would be relatively larger when the true values are less variable. This seems to be a stronger possibility for the vegetable diet data than for the other three data sets. Statistical methods can only detect patterns when there is enough genuine variation and for the vegetable question perhaps there isn't. That doesn't mean that we should ignore the weak vegetable data results, but it is a valid reason to be more cautious when we fail to see a relationship.
tl:dr, "CDC Data suggests that vigorous weekly exercise and eating fruit reduces obesity, but the data is much weaker that casual exercise or eating vegetables reduces obesity."
Footnotes: 1: text from the CDC, "Obese is defined as body mass index (BMI) ≥ 30.0; BMI was calculated from self-reported weight and height (weight [kg]/ height [m2]). Respondents reporting weight < 50 pounds or ≥ 650 pounds; height < 3 feet or ≥ 8 feet; or BMI: < 12 or ≥ 100 were excluded. Pregnant respondents were also excluded." 2: text from the CDC, "Respondents were classified as active if they reported at least 150 minutes per week of moderate-intensity activity, or at least 75 minutes per week of vigorous-intensity activity, or a combination of moderate-intensity and vigorous-intensity activity (multiplied by two) totaling at least 150 minutes per week. Adults aged ≥ 18 years. Respondents whose physical activity level could not be categorized due to missing physical activity data were excluded." 3: text from the CDC, "Respondents were classified as participating in no leisure-time physical activity if they responded "no" to the following question: "During the past month, other than your regular job, did you participate in any physical activities or exercises such as running, calisthenics, golf, gardening, or walking for exercise?" Adults aged ≥ 18 years. Respondents with missing data were excluded." 4: text from the CDC, "Adults aged ≥18 years. Respondents were asked to report via telephone survey how many times per day, week or month they consumed the following fruits and vegetables: 1) 100% pure fruit juices; 2) fruit; 3) green salad; 4) fried potatoes; 5) other potatoes; and 6) other vegetables. Total daily fruit consumption was calculated based on responses to questions 1 and 2, and total daily vegetable consumption was based on questions 3-6."