STATISTICAL TOPICS
BASICS
 Intro to Statistics
This page introduces the main concepts in statistics: descriptive statistics to summarize a data set, inferential statistics to answer questions about populations based on sample data, and a bit about three other approaches to statistics.
Intro to Statistics
This page introduces the main concepts in statistics: descriptive statistics to summarize a data set, inferential statistics to answer questions about populations based on sample data, and a bit about three other approaches to statistics.
 Summation notation
These pages introduce summation notation, how to use the sigma symbol, what summation notation is used for, and give step-by-step examples of how to use the summation notation with a data set.
Summation notation
These pages introduce summation notation, how to use the sigma symbol, what summation notation is used for, and give step-by-step examples of how to use the summation notation with a data set.
 Summary Statistics
These pages introduce and describe the most common summary statstics used to describe the location, spread, and shape of the values in a data set. Several sets of example calculations shown.
Summary Statistics
These pages introduce and describe the most common summary statstics used to describe the location, spread, and shape of the values in a data set. Several sets of example calculations shown.
PROBABILITY
 Intro to probability
This page talks about the basics of how we compute probabilities. This includes the probabilities of combinations of two events: (1) the probability of event A or B; (2) the probabilty of event A and B. It also briefly describes Bayes' Theorem. Lots of examples are provided.
Intro to probability
This page talks about the basics of how we compute probabilities. This includes the probabilities of combinations of two events: (1) the probability of event A or B; (2) the probabilty of event A and B. It also briefly describes Bayes' Theorem. Lots of examples are provided.
 The Binomial distribution
These pages explain the scenario that the binomial probability distribuition models, the assumptions required for using the equation, and give step-by-step examples of how to use the equation.
The Binomial distribution
These pages explain the scenario that the binomial probability distribuition models, the assumptions required for using the equation, and give step-by-step examples of how to use the equation.
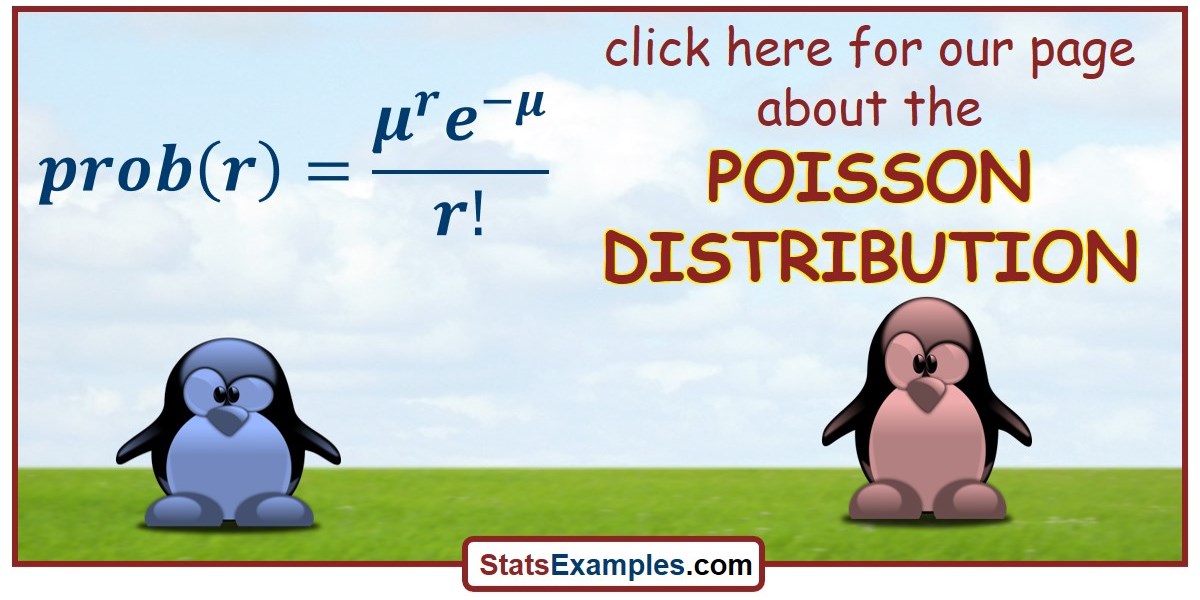 The Poisson distribution
These pages explain the scenario that the Poisson probability distribution models, the assumptions required for using the equation, and give step-by-step examples of how to use the equation.
The Poisson distribution
These pages explain the scenario that the Poisson probability distribution models, the assumptions required for using the equation, and give step-by-step examples of how to use the equation.
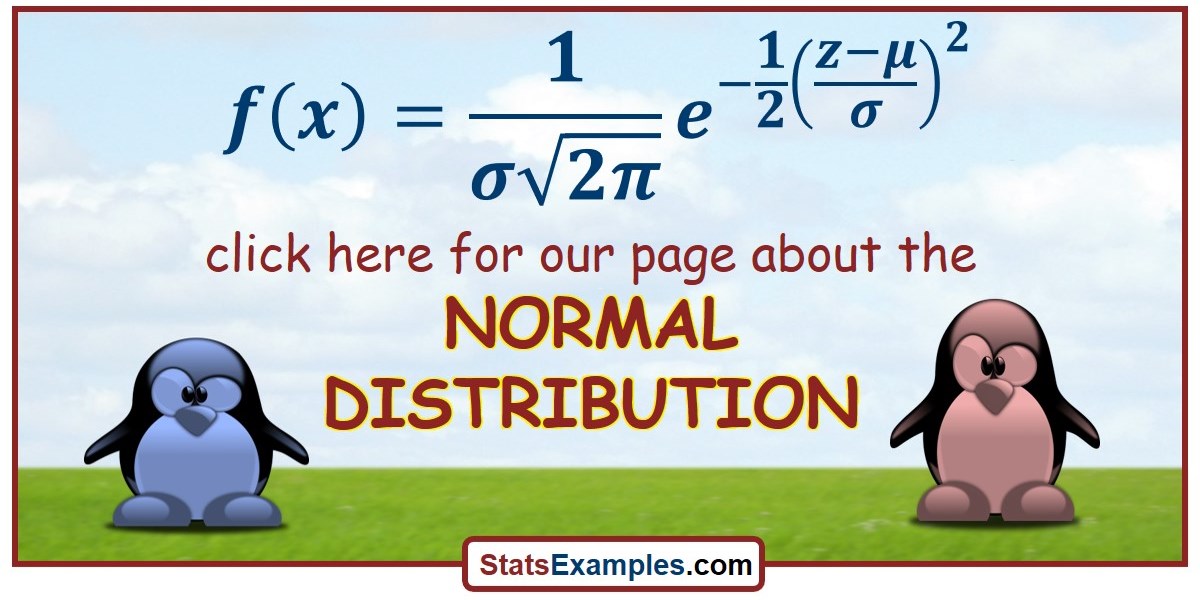 The Normal Distribution
These pages explain the scenario that the normal probability distribution models, the assumptions required for using the distribution, and give step-by-step examples of how to use the distribution.
The Normal Distribution
These pages explain the scenario that the normal probability distribution models, the assumptions required for using the distribution, and give step-by-step examples of how to use the distribution.
CONFIDENCE INTERVALS
 Confidence Intervals
This page describes confidence intervals for the mean of a population: including the central limit theorem, how the t-distribution is used to estimate where the population mean is, and several example calculations.
Confidence Intervals
This page describes confidence intervals for the mean of a population: including the central limit theorem, how the t-distribution is used to estimate where the population mean is, and several example calculations.
STATISTICAL TESTS
 One Sample T-test
This page describes how the one sample t-test can be used to test hypotheses about a population mean: including the conceptual model, how the t-distribution is used, one-tailed or two-tailed tests, and several example calculations.
One Sample T-test
This page describes how the one sample t-test can be used to test hypotheses about a population mean: including the conceptual model, how the t-distribution is used, one-tailed or two-tailed tests, and several example calculations.
 Two Sample T-test
This page describes how the two sample t-test can be used to test for the equality of pair of population means: including the conceptual model, how the t-distribution is used, one-tailed or two-tailed tests, and several example calculations.
Two Sample T-test
This page describes how the two sample t-test can be used to test for the equality of pair of population means: including the conceptual model, how the t-distribution is used, one-tailed or two-tailed tests, and several example calculations.
 Variance Ratio F-test
This page describes how the two sample t-test can be used to test for the equality of pair of population variances: including the conceptual model, how the F-distribution is used, one-tailed or two-tailed tests, and several example calculations.
Variance Ratio F-test
This page describes how the two sample t-test can be used to test for the equality of pair of population variances: including the conceptual model, how the F-distribution is used, one-tailed or two-tailed tests, and several example calculations.
 FMAX test for equality of variances
This page explains the FMAX test for comparing the variances in more than two populations to see if any variances differ or if they appear to be equal.
FMAX test for equality of variances
This page explains the FMAX test for comparing the variances in more than two populations to see if any variances differ or if they appear to be equal.
 Chi-squared technique
This page describes how the chi-squared technique can be used with frequency or count data to test for goodness of fit, independence, or homogeneity: including the conceptual model, how the chi-squared distribution is used, and several example calculations.
Chi-squared technique
This page describes how the chi-squared technique can be used with frequency or count data to test for goodness of fit, independence, or homogeneity: including the conceptual model, how the chi-squared distribution is used, and several example calculations.
ANOVA and CORRELATION
 one factor ANOVA
This page describes the one factor ANOVA and how it can be used to compare multiple samples to see if the population appear to have different means.
one factor ANOVA
This page describes the one factor ANOVA and how it can be used to compare multiple samples to see if the population appear to have different means.
 Correlation and Regression
This page explains the correlation and regression techniques for determining whether two variables exhibit a nonrandom association with one another.
Correlation and Regression
This page explains the correlation and regression techniques for determining whether two variables exhibit a nonrandom association with one another.
OTHER TOPICS
 Type I and II errors
This page explains the two main types of statistical errors: type I (where we reject a true null hypothesis) and type II (where we accept a false null hypothesis. The metaphor of the US justice system is used to make this clear.
Type I and II errors
This page explains the two main types of statistical errors: type I (where we reject a true null hypothesis) and type II (where we accept a false null hypothesis. The metaphor of the US justice system is used to make this clear.
 False Positives and Negatives
This page explains how the probability of getting a false positive or negative result depends on both the accuracy of the test and the probability of the null hypothesis being true (i.e., the frequency of the scenario being tested for).
False Positives and Negatives
This page explains how the probability of getting a false positive or negative result depends on both the accuracy of the test and the probability of the null hypothesis being true (i.e., the frequency of the scenario being tested for).
 Power Analysis
This page explains what power analysis is. It defines the power of a statistcial test and uses a two-sample homoscedastic t-test to show how important the pattern, variance, sample size, and type of test are in determining power.
Power Analysis
This page explains what power analysis is. It defines the power of a statistcial test and uses a two-sample homoscedastic t-test to show how important the pattern, variance, sample size, and type of test are in determining power.
Connect with StatsExamples here
This information is intended for the greater good; please use statistics responsibly.