Fmax distribution (α=0.05)
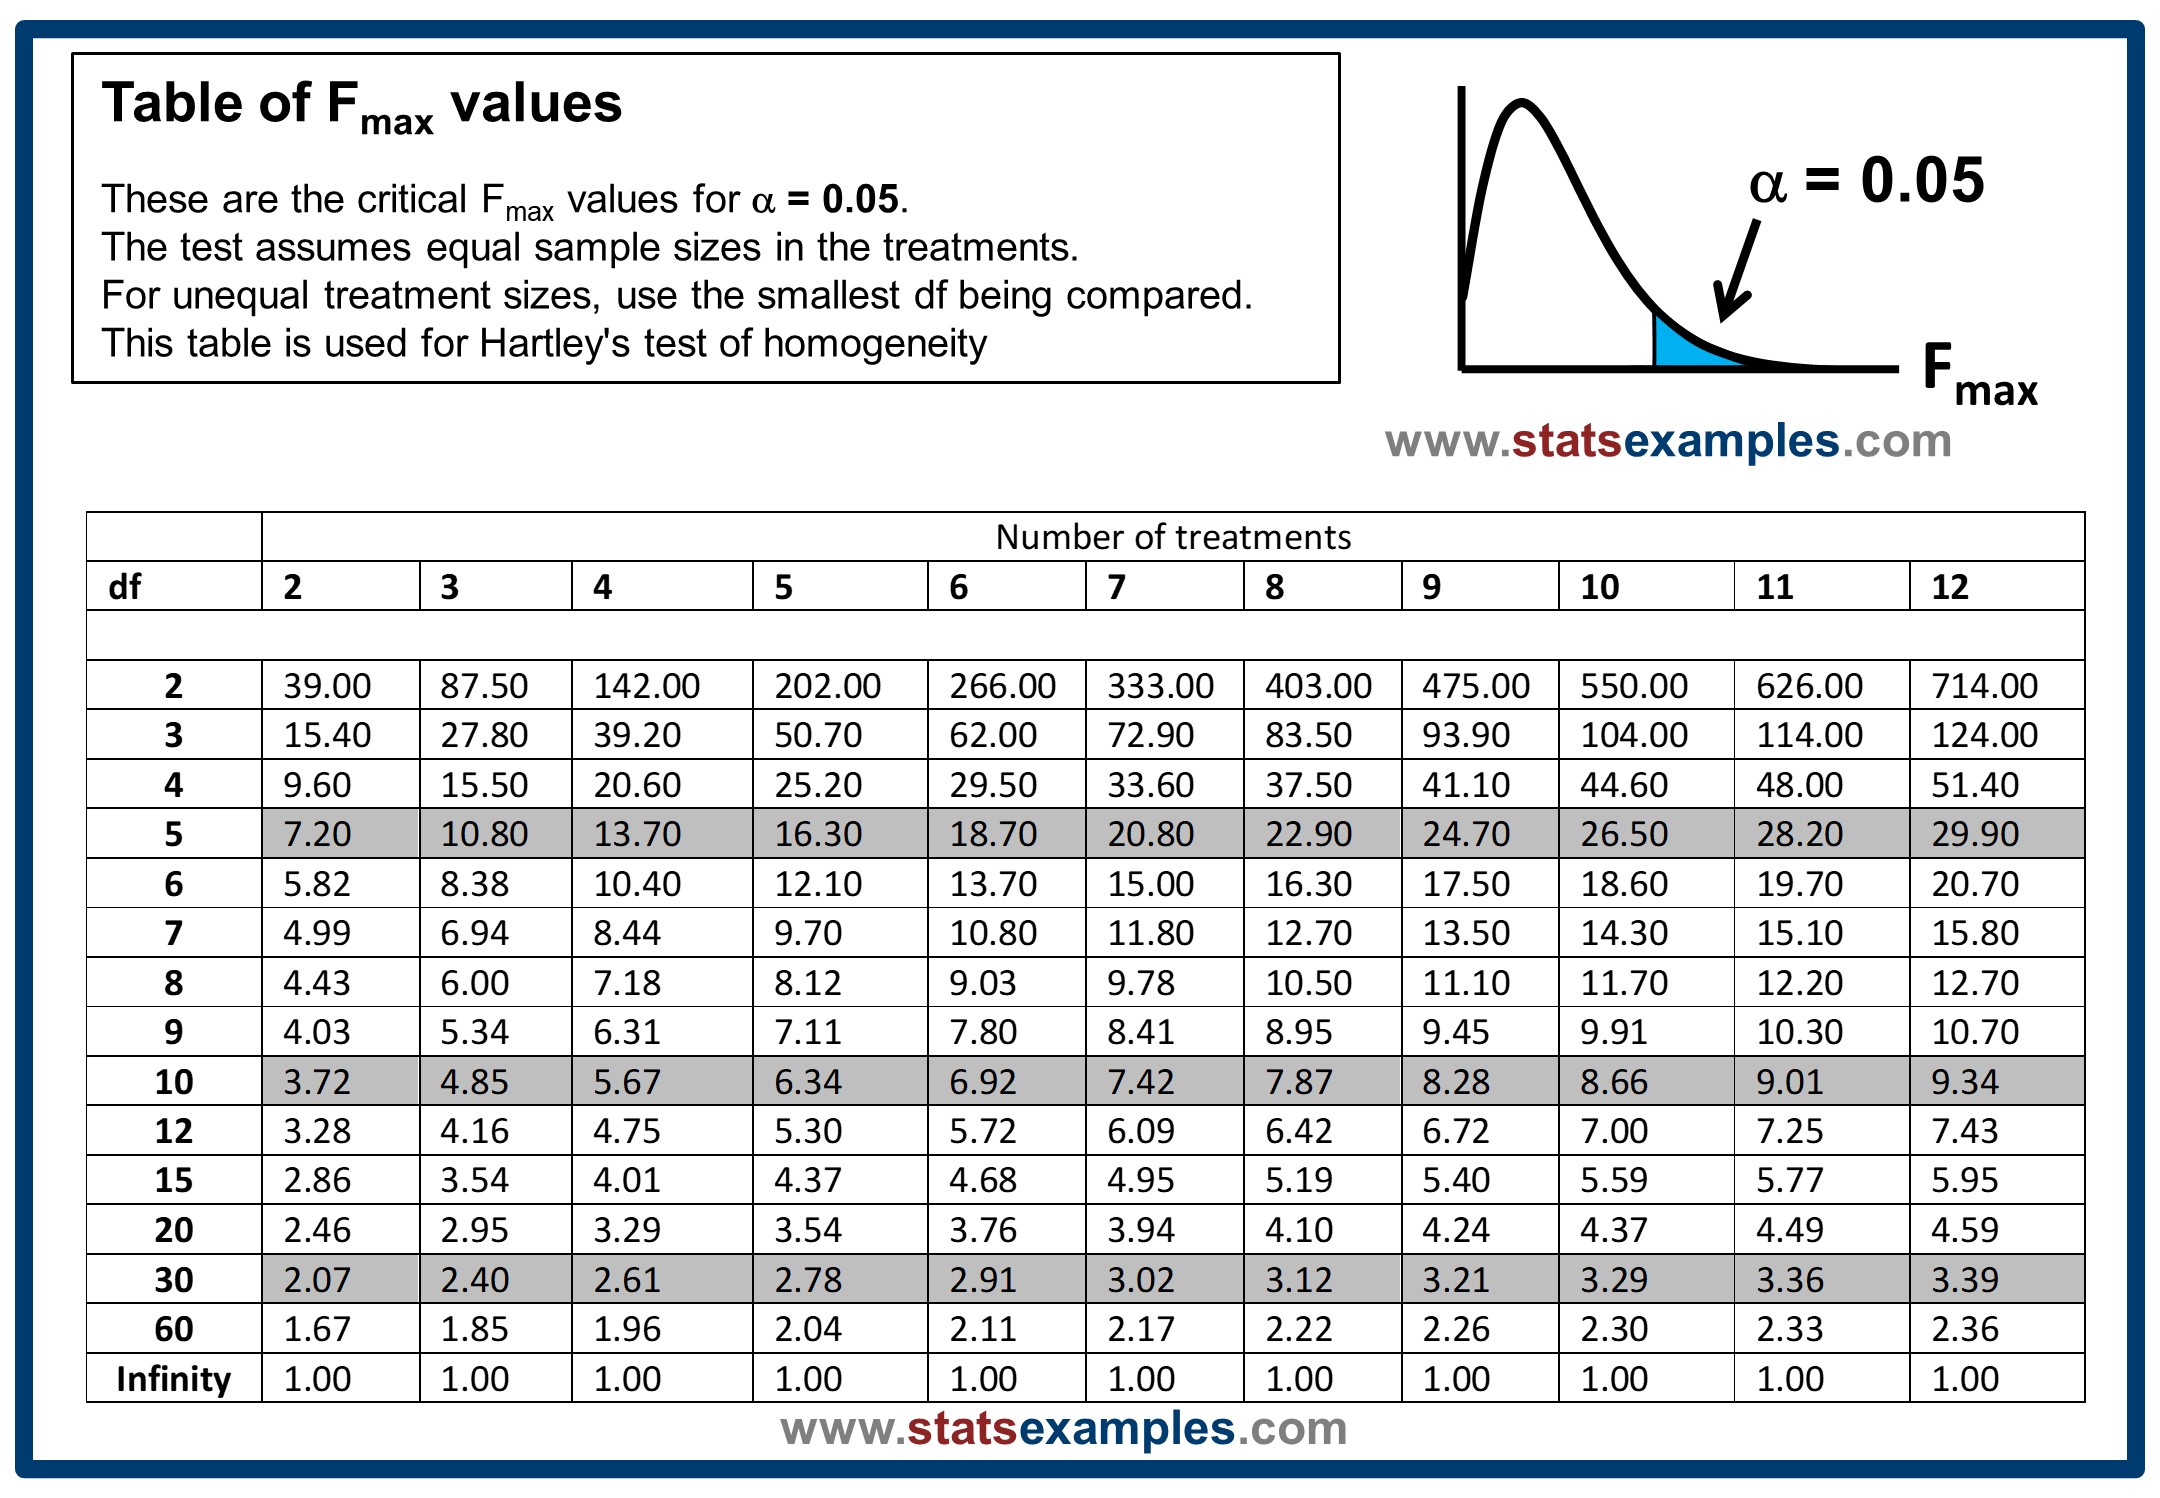
The table below shows critical values for the Fmax probability distribution. The table displays Fmax values corresponding to α=0.05. These values are used for determining significance when doing an Fmax variance ratio test.
Typically, if you are deciding whether the observed variances deviate significantly from one another, you are interested in whether the calculated F value exceeds the F value in the table below corresponding to the column for the number of treatment groups and the row for the degrees of freedom in each of the groups.
If you prefer to download or view a PDF of this table instead, CLICK HERE
Connect with StatsExamples here
This information is intended for the greater good; please use statistics responsibly.