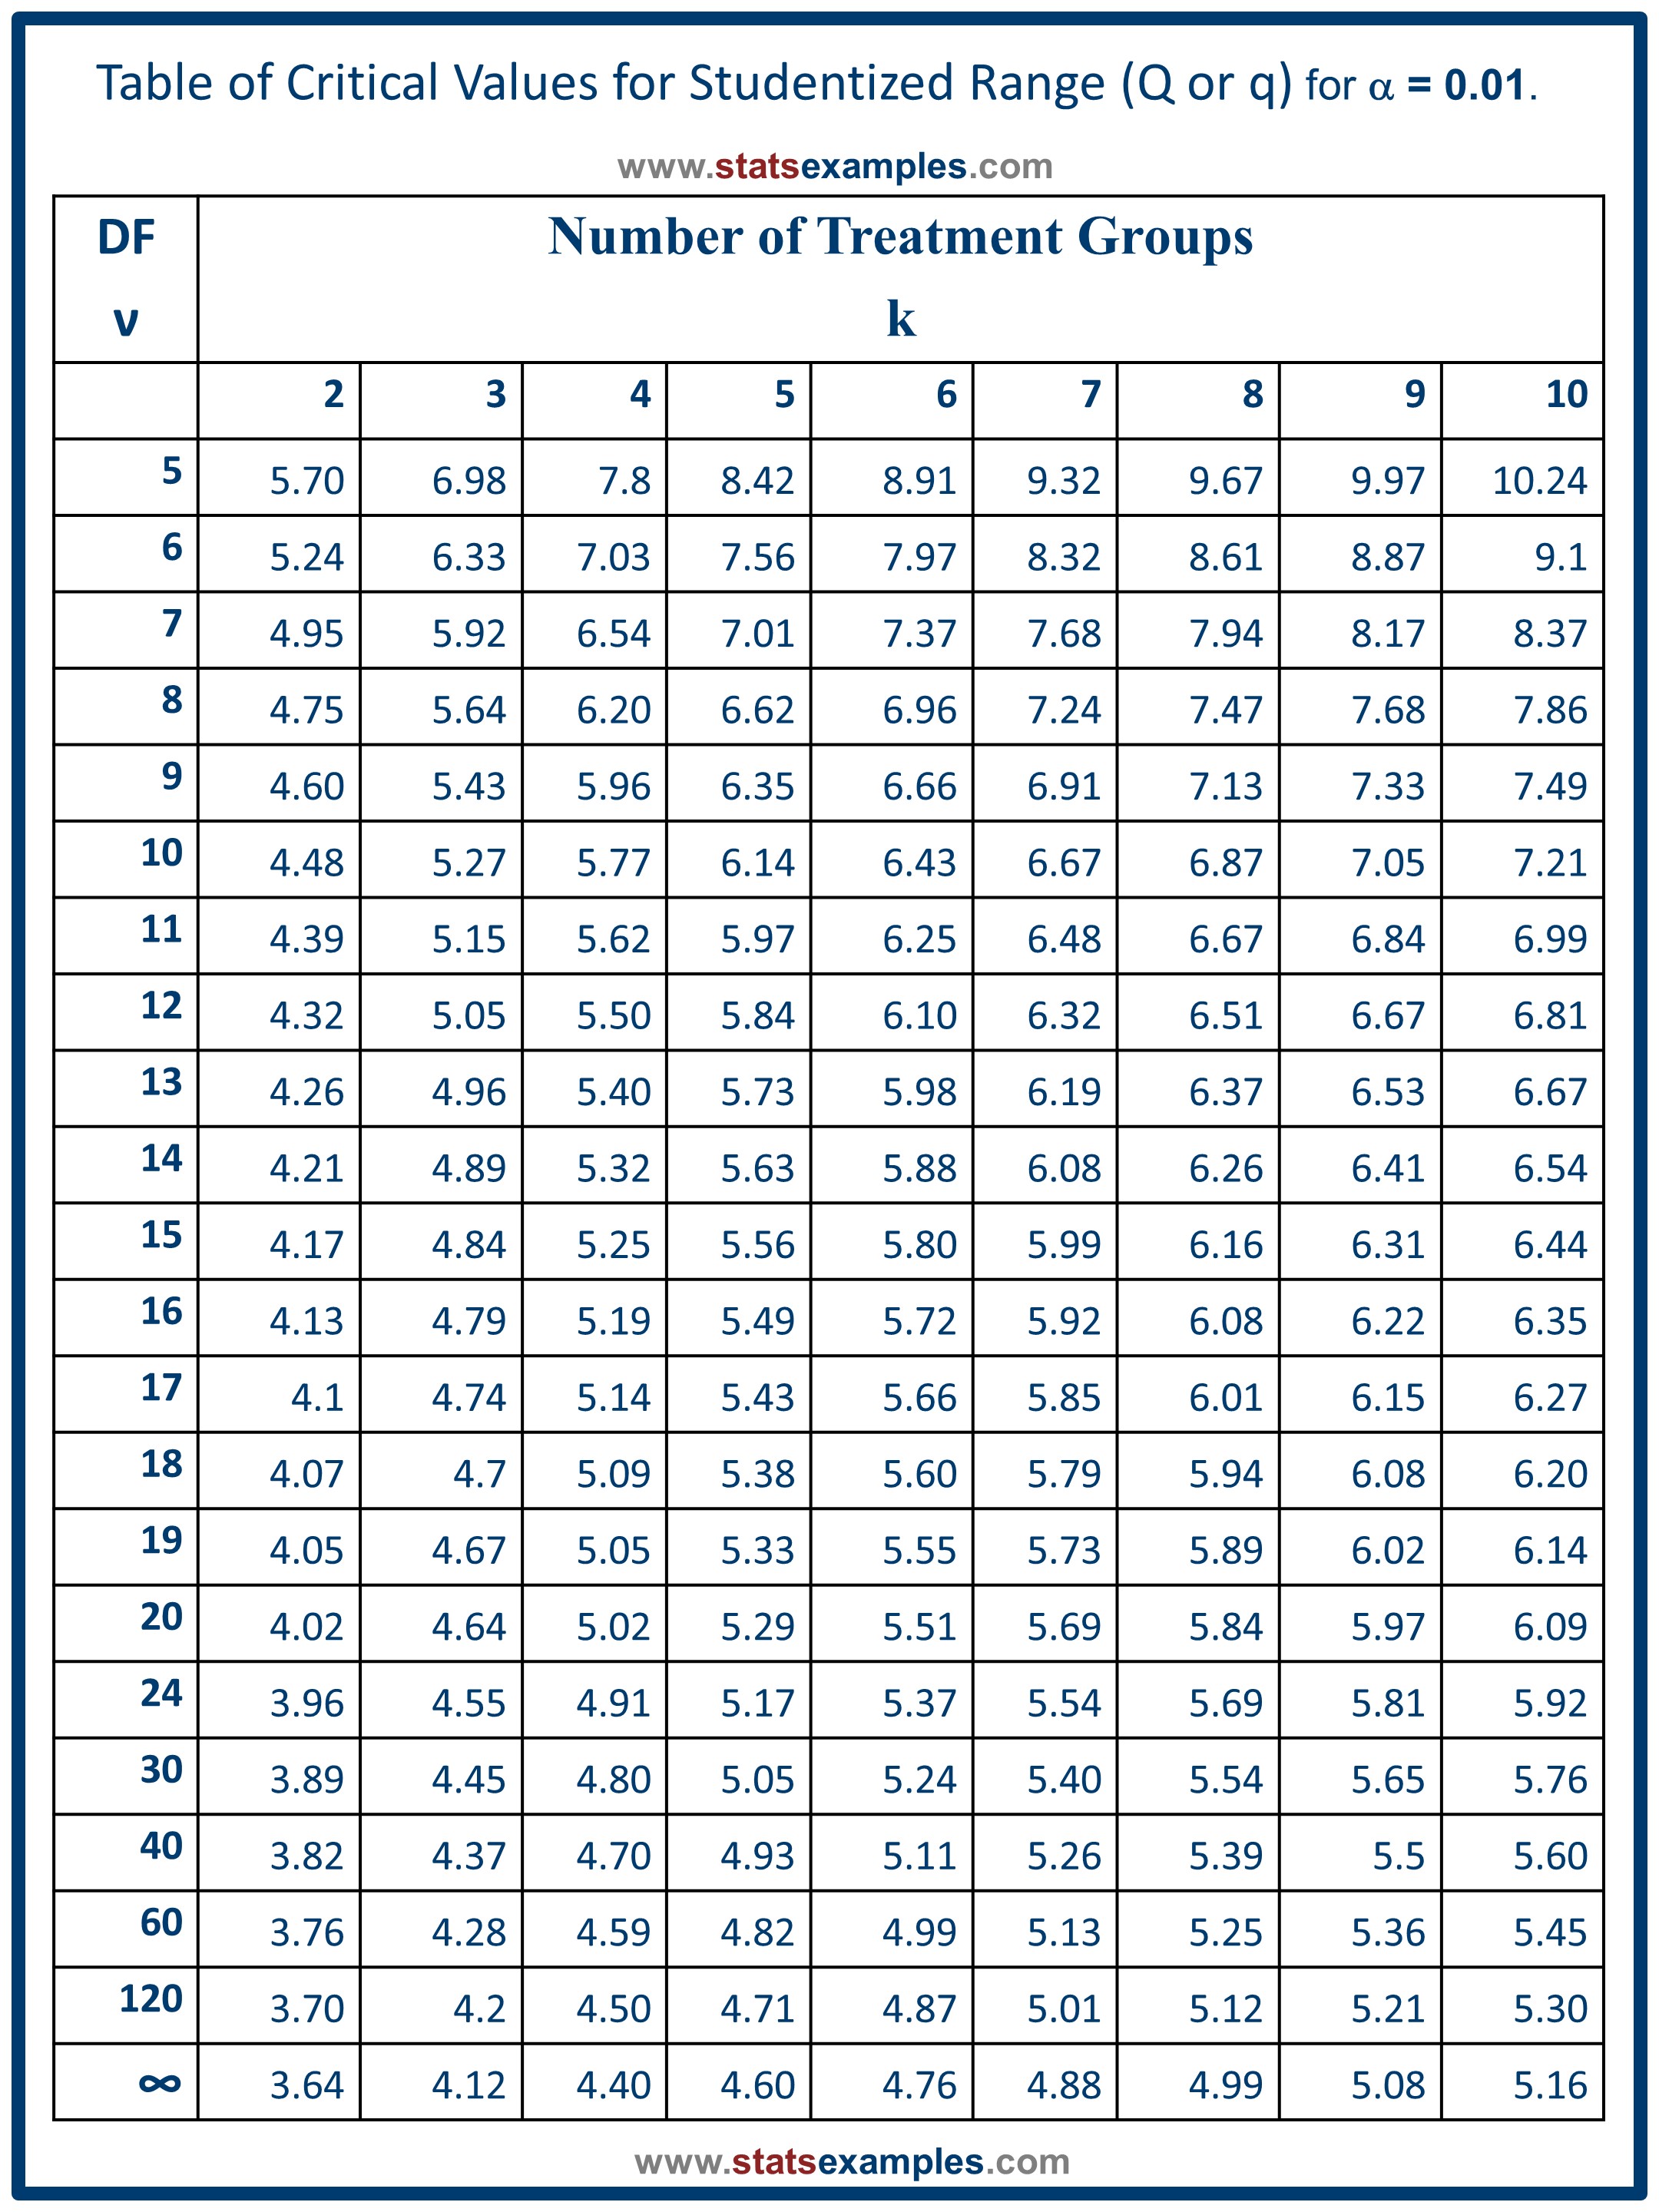
Studentized range distribution (i.e., Q values) (α=0.01)
The table below shows critical values for the studentized range distribution, the Q, probability distribution. The table displays Q values corresponding to an alpha value of 0.05. These values are used for determining honest significant differences when calculating Tukey-Cramer minimum significant differences (also termed honestly significant differences).
To choose the correct Q value, use the column corresponding to the number of comparison groups and the row corresponding to the degrees of freedom within each one.
If you prefer to download or view a PDF of this table instead, CLICK HERE
Connect with StatsExamples here
This information is intended for the greater good; please use statistics responsibly.