X2 distribution
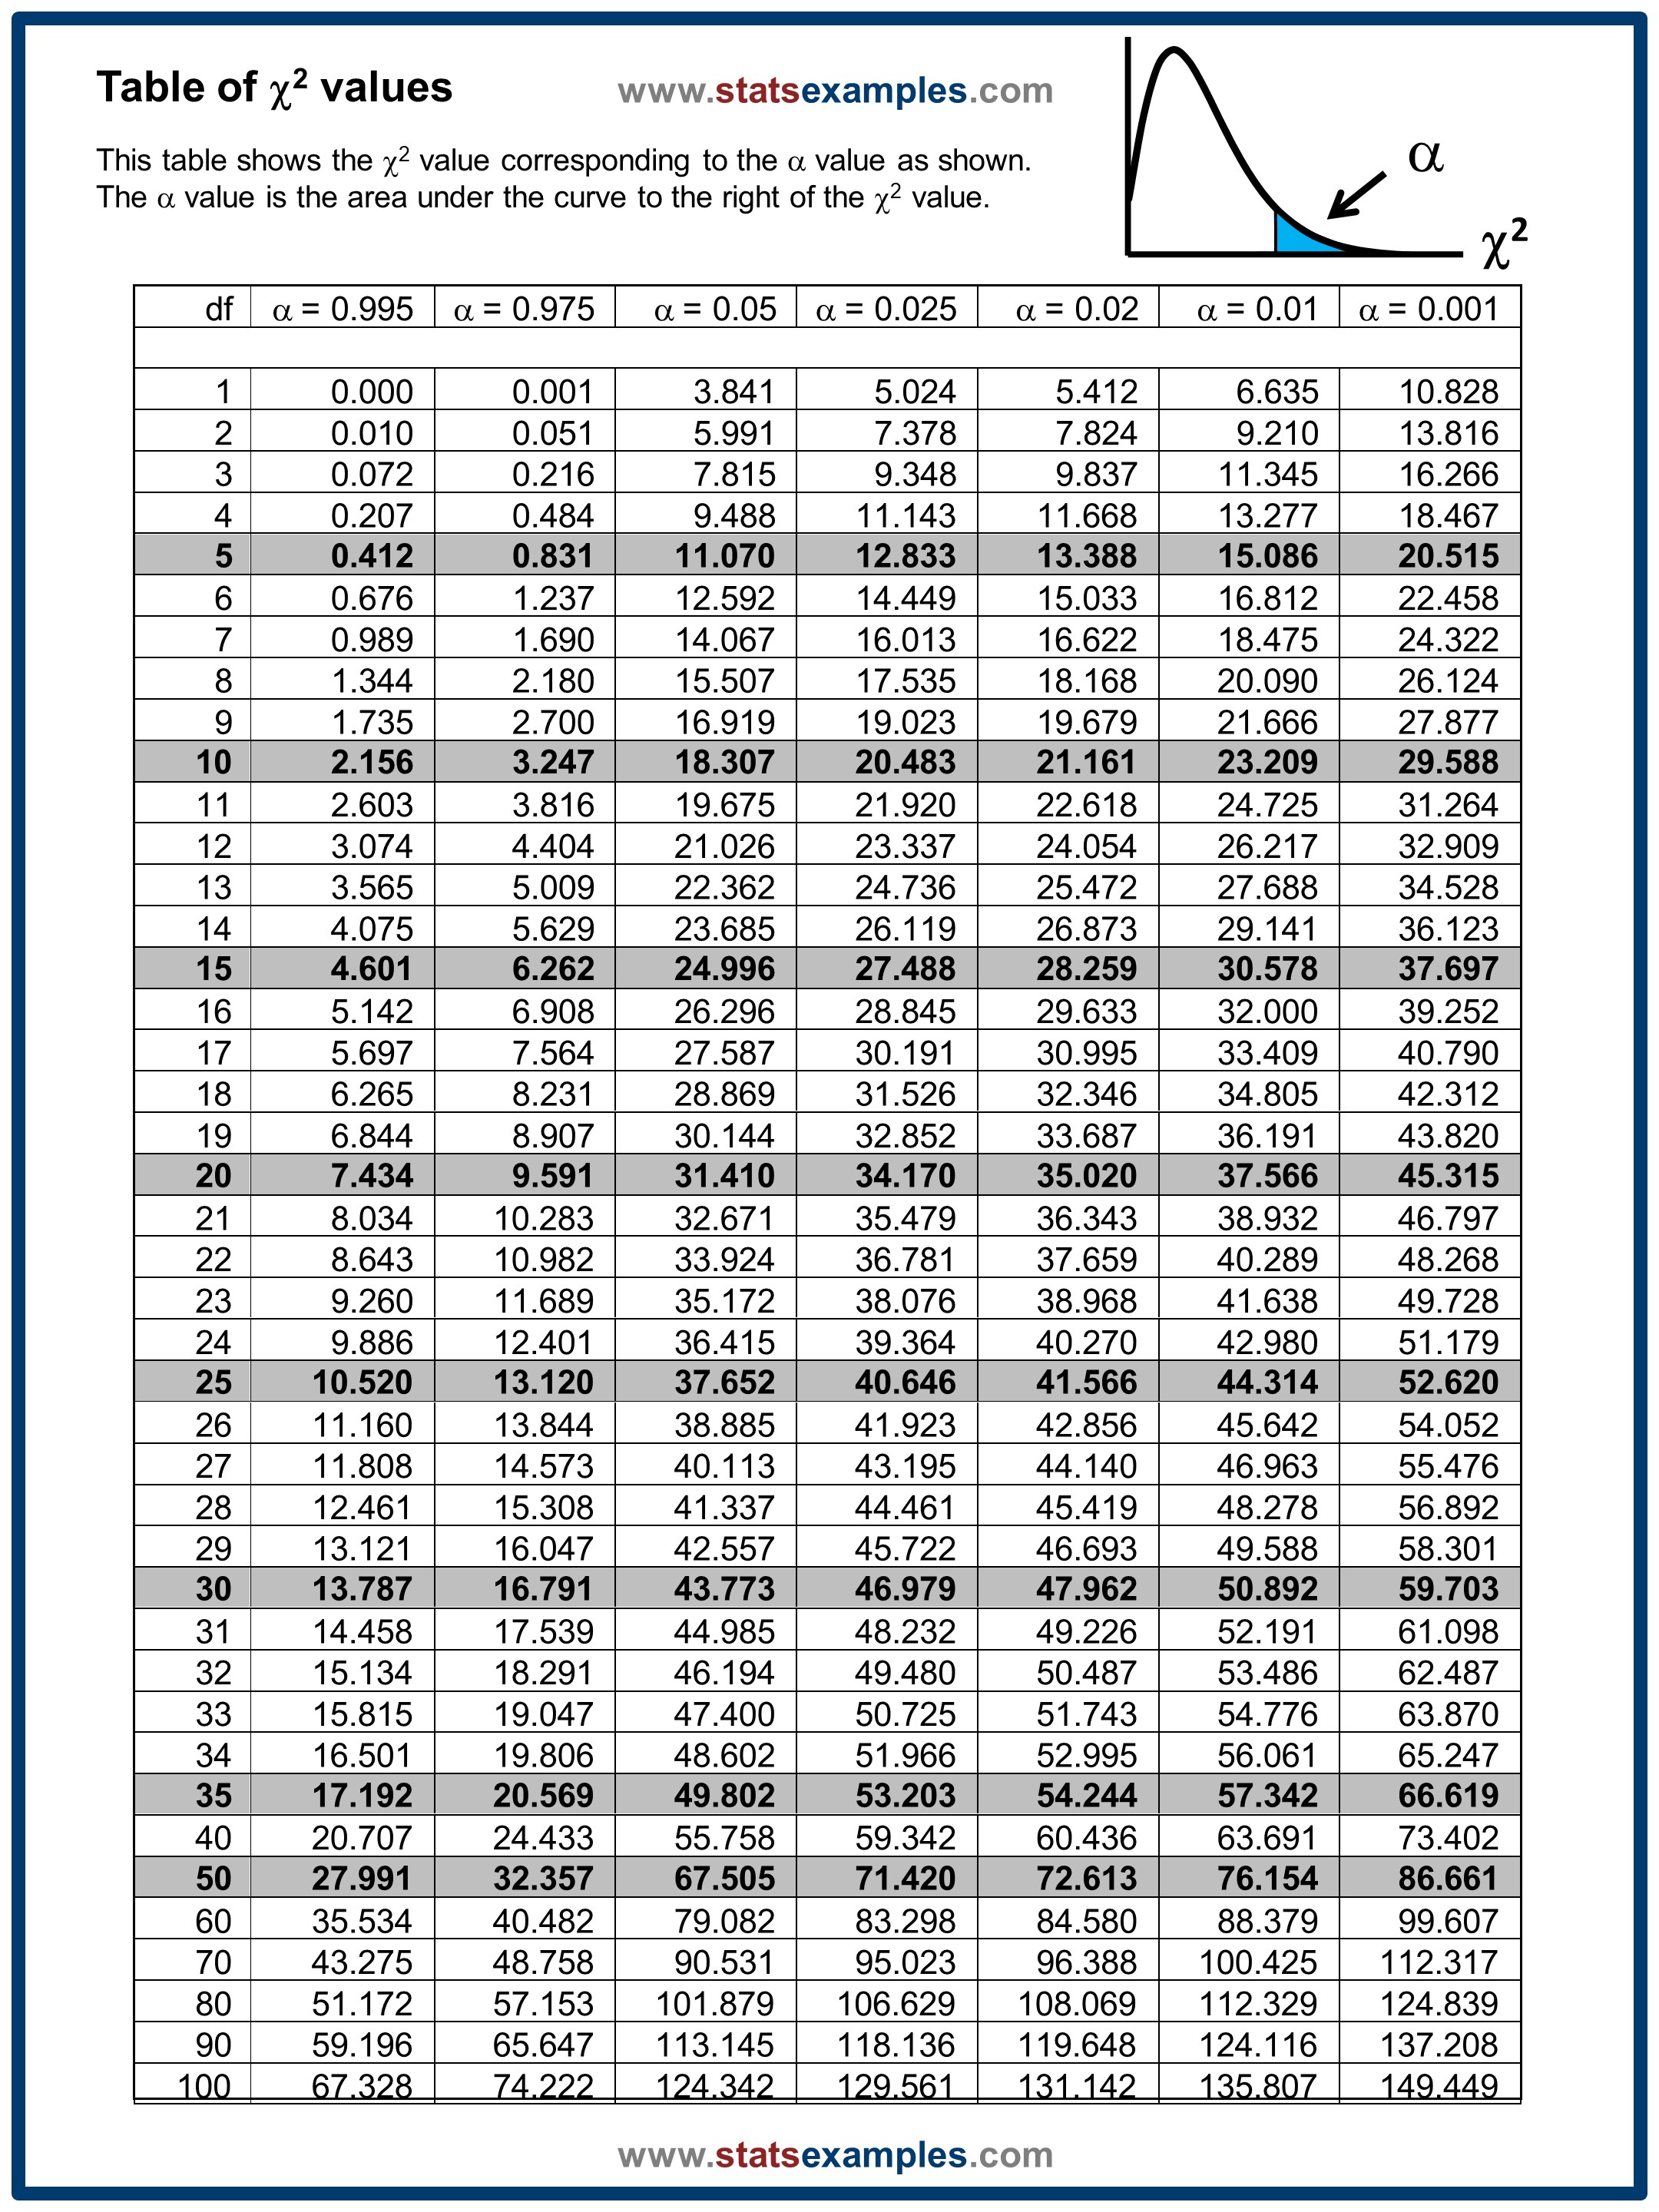
The table below shows critical values for the chi-squared (χ2) probability distribution. The table displays χ2 values corresponding to selected alpha values from 0.995 to 0.001. These values are used for determining significance when doing chi-squared goodness-of-fit tests and chi-squared tests of independence or homogeneity.
Typically, if you are deciding whether the numbers of obsverved values in the categories deviate significantly from the model expectation or predictions based on independence of homogenity, you are interested in whether the calculated χ2 value exceeds the χ2 value in the table below corresponding to the column for α=0.05.
If you prefer to download or view a PDF of this table instead, CLICK HERE
Connect with StatsExamples here
This information is intended for the greater good; please use statistics responsibly.